If you have ever opened the annual report of the company you will come across hundreds of numbers staring at you in the form of tables. While all these figures are important to make a rational investment decision, you will most likely be uncertain about what they mean and how to interpret them? Let me tell you that the numbers and tables that you are staring at is most likely be your company’s balance sheet. In this post I will discuss how to preform proper and detailed balance sheet analysis and make rational investment decisions based on the information you get out of analyzing them?
What is a Balance Sheet?
A balance sheet is one of the three financial statements of the company (namely, Balance Sheet, Profit and Loss statement and Cash Flow Statement). A balance sheet is a snapshot of all that a company owns (also known as the assets) and what the company owes (also known as liability). If that sounds too complicated to understand, think of it as your own CIBIL credit score report.
Your personal CIBIL credit report lists out all the assets you own ( such as house, plots of land, car, shares, cash and bank deposits) and things you owe (such as house loan car loan, credit cards dues outstanding). Just like you CIBIL report, a balance sheet is also a CIBIL report of a company.
Importance of Balance Sheet
Analysis of balance sheet is one of the core of investing as it helps in understanding the financial health of the company, its capital structure (how it is financed)and analyse the potential value of the business.
It helps you unearth the financial advantages and disadvantages that a company may have over its peers.
It helps you understand and, to a certain extent, forecast what is going on in the business and how its future may pan out.
Analysis of balance sheet also helps you find the true value of the business (also known as the Net worth or Book Value) and find out if you are paying too much for the company compared to the present or future value of the business.
The Balance Sheet Equation
Before we jump to analysis of balance sheet, we need to understand the basic equation. The balance sheet has three major components.
Assets, liabilities and Equity (aka Shareholder’s Equity)
The basic equation of the balance sheet is as follows:
Assets = Liabilities + Shareholder’s Equity
The equation above simply means that the assets created by every company comes from two capital sources, either by borrowing (liabilities) or from the capital invested by shareholders (shareholder’s Equity). These assets are then used by the company to provide goods and services to the customer and clients in return of profits to the company.
Understanding Components of a Balance sheet
Lets understand each component of the balance sheet and understand how careful balance sheet analysis can not only help us understand the financial standing of the company, but also make wise investment decisions.
Assets
In order to keep growing, every company needs to expand its business which is possible only if the company buys more assets and use them to produce more goods and services.
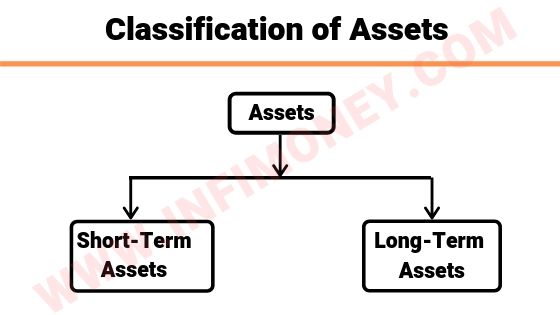
- Long Term Assets (also called Non-Current Assets)
- Short Term Assets (also called Current Assets)
Long term or non-current assets are the ones that are held by the company for more than one year and cannot be converted into cash easily.
Short term assets are the ones that are held by the company for less than one year period and can be quickly converted in to cash. On the other hand
Let us dig a little deeper and analyze each type of asset in detail and understand its importance and impact on the balance sheet.
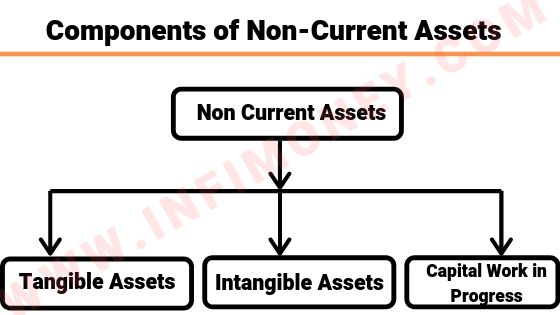 Non-Current Assets:
The Non-current assets can be further divided into following:
- Tangible Assets
- Intangible Assets
- Capital Work in Progress
Tangible Assets: Also known as fixed assets, tangible assets are the real assets that have a physical existence such as plant machinery, equipment. Fixed assets are directly used by companies to produce goods and services for their customers.
If a company acquires more assets over the years, it is an indication that company is expanding its business.
However, looking solely at the assets growing is not enough, since a company acquires assets to increase its profits, if the company fails to improve its profits it is a huge red flag for investors as it shows that the company is unable to use its assets in a productive manner, which may lead to problems in the future.
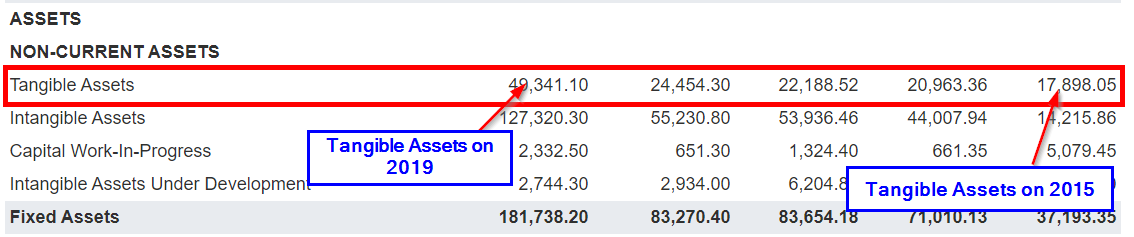
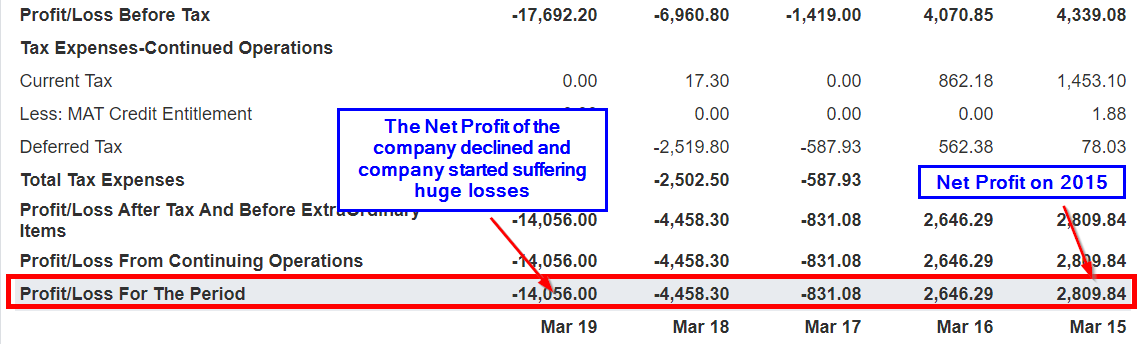
For Example, If you look a the 5 years of the historical balance sheet of VI Ltd, you will find that the company has seen huge growth in tangible assets( for which it also borrowed heavily), the total tangible assets of the company went up from Rs. 17,898 crores in 2015 to Rs. 49,341 crores in 2019.
However, the profit of the company failed to improve, as a result of which the company started to perform poorly.
Apart from these, there are other forms of intangible assets such as copyrights used by music and movie production houses such as Disney and trademarks or brand names used by big businesses.
Capital work in Progress: Capital work in progress is the assets that are under development. When an asset is incomplete at the time of making the balance sheet, the total amount spent on it is written under capital work in progress.
For example if a company is building a new factory to expand its production capacity, and the building is not ready to start production, all the capital invested in that building by the time of preparing the balance sheet is written under capital work in progress.
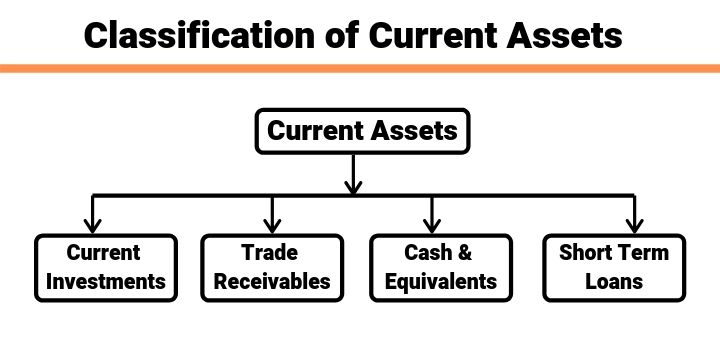
Current Assets
As I have already mentioned earlier, current assets are the short term assets that can be easily converted to cash within a year’s period. Why current assets are important? Because current asset allows a company to maintain sufficient liquidity against short term liabilities.
Current Assets can be divided into many subheads as follows:
- Current Investment
- Trade Receivables
- Cash and Cash Equivalents
- Short Term Loans and advances
Current Investments: Current investment are short term investments that are about to mature within one year. Current investment may include short term bonds, multi-year investments that are due this year, short term equity holdings in a company.
Trade receivables: Trade receivables are the payments that a company has to receive from other businesses or its customers. As a thumb rule, trade receivables should always be less than trade payable(why? we will talk about it in our current liabilities section), as it shows that company is able to collect payments faster than it has to pay to others.
This difference gives companies some time to hold cash in hand which can be used by the company for short term cash purposes.
Cash and Cash Equivalents: Cash and cash equivalents shows how much cash a company has in its bank. Cash or cash equivalents is either the cash in the hands of the company or highly liquid financial instruments that can be converted into cash quickly such as cheque received from client.
An important point that you should keep in mind while analyzing cash and cash equivalents is that a company should have cash and cash equivalents higher than its short term borrowings (why? we will talk about it in our current liabilities section)
Short Term Loans and Advances: Short term loans and advances as the name suggests are short term loans that a company gives either to its clients or to its subsidiary companies. These loans are for short term and due within 12 months of time.
Liabilities
Liabilities is what a company owes to others, or has to pay someone in the future. While it is okay for a company to have some liabilities, if the total liabilities exceeds total assets of the company, it’s a dangerous sign as it shows that company may not be able to meet all its obligations and may have to default on some of them.
Liabilities of the company can be divided into following categories:
- Non-Current Liabilities
- Current Liabilities
Let us look at each of them in detail
Non-Current Liabilities
Non-Current liabilities are also known as long-term liabilities and as the name suggests, these are the liabilities of the company that will be settled 12 months after the date of reporting. Non-Current liabilities can be recorded under three heads:
- Long term borrowings
- Deferred Tax Liability
- Long Term Provisions
It is important to remember that not all of these heads have equal impact on the financial health of the company, in other words, some of these heads do not have significant impact on the financial health of the company while there are some that can truly make or break a company’s financial future.
Long Term Borrowings: It is the money that a company has borrowed from an external source (such as bank or a bond market), in the form of debt. Think of it as a car or home loan that you borrow from bank.
Long term borrowing is important as it can have a significant impact on the liquidity and stability of the business.
When a company borrows capital as debt, it has to pay a fixed interest on its borrowings every month to the bank or lender (just like you pay your EMIs on loan).
While borrowing a small amount may not hurt the business, the problem arises when company takes too much debt or when the company starts suffering losses.
If a company’s profits decline, or it starts suffering a loss, it still has to pay the interest to the bank, (just like you have to pay your EMIs even if you lose your job), because of which the company may have to sell its assets to meet the interest payments or in extreme cases, even file for bankruptcy.
The question is, how much of borrowing is good for the company? There is also a thumb rule for it. The debt of the company should not exceed half of its Shareholder’s Equity. You can get this information by looking at the debt to equity ratio of the company, if it is higher than 0.5, then make sure that company is generating enough profits to meet those interest obligations.
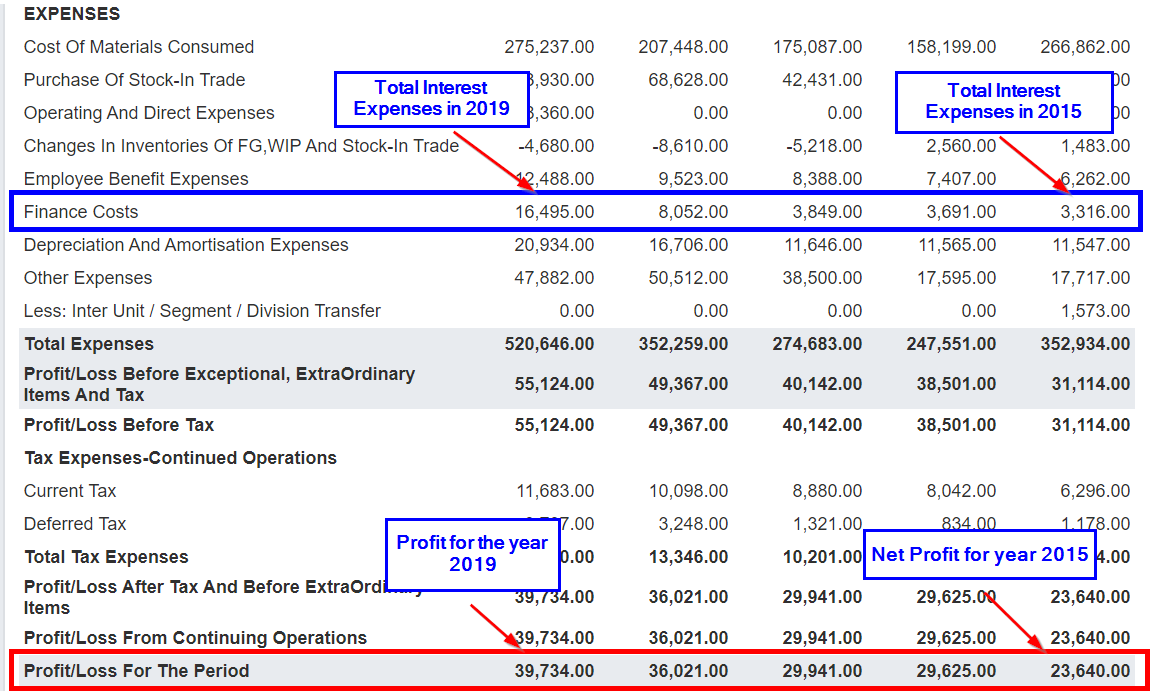
For Example, If you look at the consolidated balance sheet of Reliance Industries, you will find that the total debt on the balance sheet of the company is at Rs. 2,07,506 crores, while the total shareholder’s equity is at Rs. 387,112, which means that debt to equity ratio of the company stands at 0.7, which means that debt of the company is above the comfortable levels of 0.5.
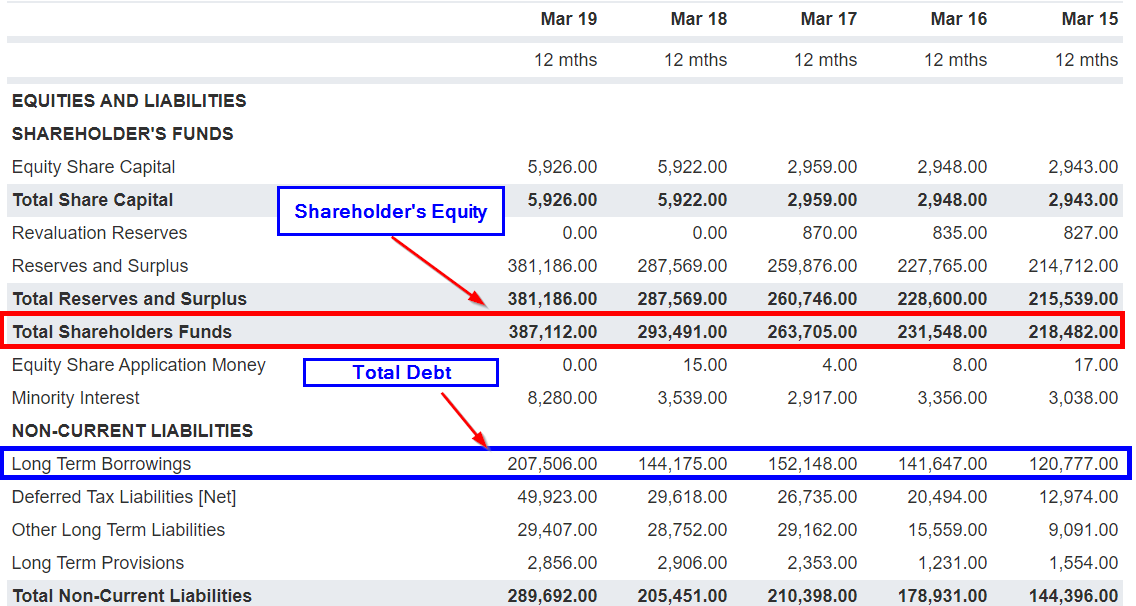
But is the company generating sufficient profit to meet its interest expenses? If we look at the interest expenses of the company, as on 2019, the total interest expenses of Reliance Industries stands at Rs.16,495 crores whereas the total Net Profit of the company is at Rs. 39,734 crores, which means that 41.5% of company’s Net Profit gets eaten away by interest cost. In 2015, the percentage was at 10%. Clearly, this shows that company’s financial health is deteriorating.
Deferred Tax liability: The second head in the non-current liability is deferred tax liability. It usually forms a very small portion of the non-current liabilities. It is a provisional fund maintained by the company used to pay forthcoming tax dues if any.
Long term Provisions: Long term provision is a part of non-current liability where company keeps some funds aside as provision for the future. Long term provisions usually have cash reserves meant to be paid to company employees in the form of pension, provident funds, gratuity, leave encashment etc. The long term provision may also contain funds for income tax payments, dividend for shareholders and dividend distribution tax.
Current Liabilities
Current liabilities are also the obligations that a company owes, the only difference between non-current and current liabilities is that current liabilities must be paid under 12 months’ time. Current Liabilities have following heads:
- Short Term Borrowing
- Trade Payable
- Short Term Provisions
Let us begin and analyse each of them one by one.
Short Term Borrowing: Just like long term borrowing, where companies borrow finds for long term, that is more than a year, short term borrowings is the capital borrowed for a short span of time, that is, less than 12 months.
Companies that are able to fund their operational expenses from their own profits usually have very little short term borrowing.
The best way to analyse if the company will be able to pay short term borrowings is by looking at how much cash and cash equivalents the company has in its accounts.
If the cash in hand held by the company is higher than short term borrowings, it’s a sign that company is well funded and will be able to pay off its short term borrowings easily.
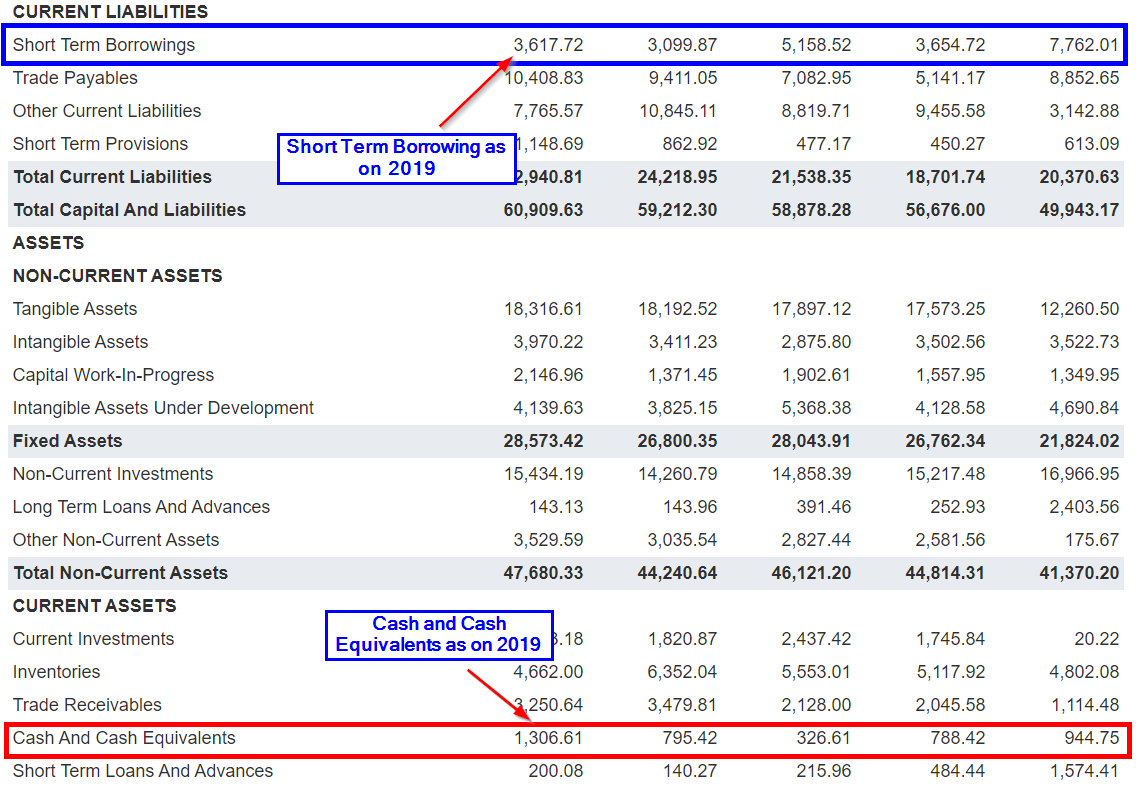
For example, If you look at the balance sheet of Tata Motors you will find that, the company has short-term borrowing of Rs. 3,617 crores (as of 2019), while the total cash and cash equivalents of the company stand at Rs.1,306.61 crores, the numbers clearly show that Tata motors has insufficient cash to meet its short term obligations and may face short term liquidity crisis in the future.
Trade Payable: Trade payable is one of the most important heads under the current liabilities segment. Trade payable is the amount that a company is liable to pay to its suppliers within 12 months.
Trade payable should always be looked at in comparison to trade receivables, which is the amount the company has to collect from its customers and suppliers. Trade receivables can be found under the current assets head.
If a company has trade payable higher than receivables, it is a positive sign for the company as it shows that the company is able to hold on to cash which can be used to fund short term capital requirements.
On the other hand if the trade receivables are higher than trade payable, it shows that company is unable to receive payments from its clients or customers while it has to pay to its suppliers which causes delay in making payment and can also hinder operations of the company.
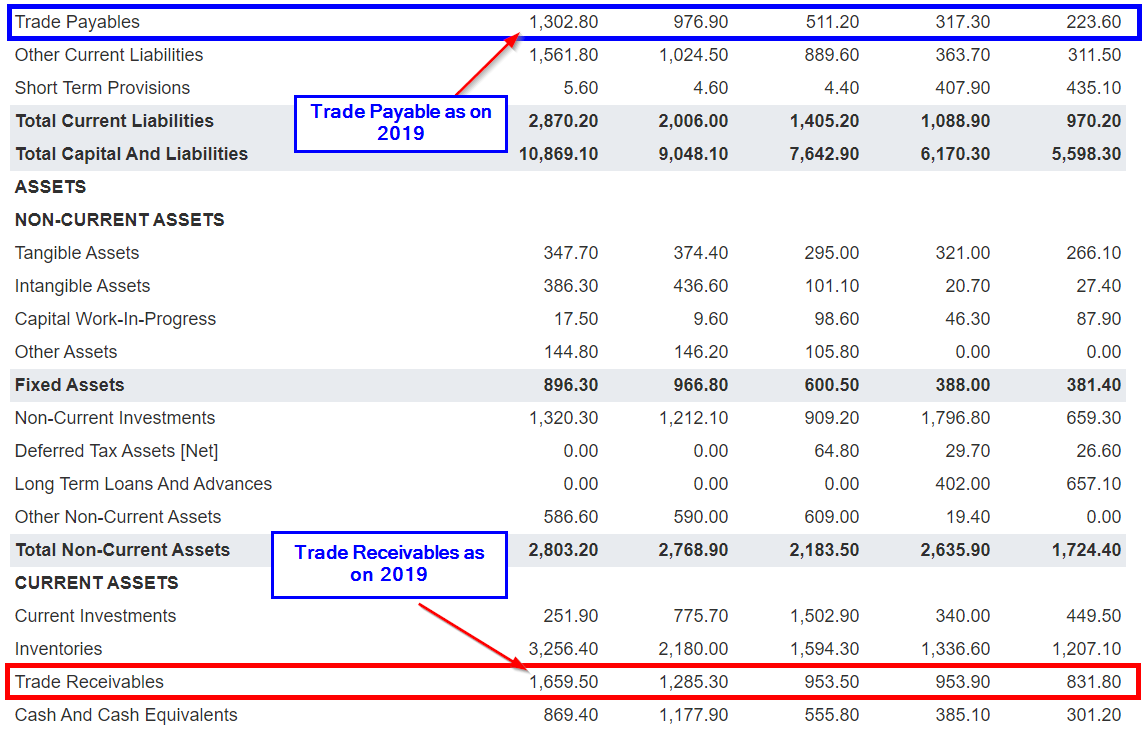
An example of poor trade payable to receivables can be seen in the balance sheet of Zee Entertainment.
If you look at the balance sheet of Zee Entertainment, you will find that in the year 2019, the total trade payable of the company stands at Rs. 1,302 crores, while the trade receivables stood at Rs. 1,659 crores, that is, the total receivables is much higher than trade payable.
Short Term Provisions: Short term provisions, just like long term provisions is some cash set aside for specific purpose, the only difference is that all the short term provisions should be paid within 1 year.
Shareholder’s fund
We finally arrive at the most important segment of the entire balance sheet called the shareholder’s fund. The reason why its so important is because it is the capital that is contributed by the shareholders of the company.
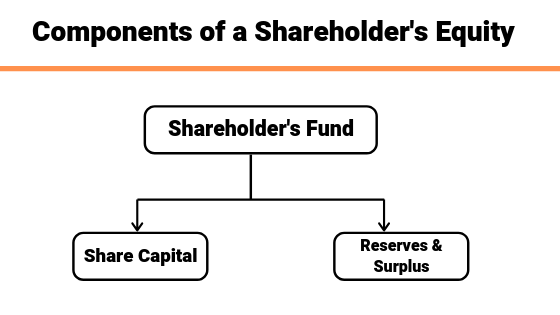
Share Capital
Share Capital is something that is rarely seen as something significant in the balance sheet of the company, especially from business point of view, but since you are an investor, share capital become an important aspect you should not ignore.
So what is a share capital after all? Share capital is the money that a company generates from IPO, so in that sense, share capital is the money that a company borrows from its shareholders, this is the reason why it is considered as a liability of the company.
Share Capital is calculated by multiplying the total number of shares issued by the company during IPO (or whenever the company dilutes its equity and issues more shares to shareholders) to the face value of which is usually Rs.10 per share.
So if a company has issued 100 shares and the face value of each share is Rs.10, the total share capital of the company would be 100 X 10 = 1000.
Why is Share capital so important? Because share capital is affected by equity dilution, which may have a significant impact on the financial health of the company. How? Equity dilution means that company issues more shares to raise capital from shareholders, diluting equity increases the share capital of the company as more shares come in the hands of retail shareholders.
Although equity dilution is not always a negative sign especially if the company is able to boost earnings using the capital borrowed, however, if the company has diluted its equity but is unable to grow its earnings, then it should be seen as a warning sign for the company and the investor.
Also, if a company is continuously diluting its equity almost every year, it should be seen as a strong indicator of deteriorating financial health of the company as it shows that company is fund its expenses from its internal accruals and has to continuously rely on external funding for its survival. The day external funding stops, the company will die immediately.
Reserves and Surplus
Another critical part of the balance sheet that is crucial to understand of the company is adding or eroding shareholder value.
Reserves and surplus is formed when Net profit of the company is accumulated over past years. Think of it as your savings account where you park your monthly savings to use in future if the need arrives.
For example if a company generates a Net profit of Rs. 100 and pays a dividend of Rs. 20 to investors, the remaining Rs. 80 get transferred to reserves and surplus.
These Reserves can be used for future expansion of business such as buying a new machine such as plant and machinery, which comes under capital expenditure.
There are instances were companies also use reserves and surplus to reduce debt burden from their books.
If a company suffers a loss during a financial year, no amount gets transferred to reserves and surplus, in rare cases a company may even debit its reserves account to meet its operational expenses.
A declining reserve is a negative sign as it indicates that company is eroding shareholder’s value by eating away the past retained earnings.
Analysis of Shreholder’s Equity
The question is, how do you analyze shareholder’s funds? here are the few points that you should pay attention to while analyzing shareholder’s fund.
A continuously improving shareholder’s equity is a positive sign that an investor should be looking at in the balance sheet of the company.
Ideally, an investor must analyze at least 5 years of historical balance sheet and look at the growth trend and rate of growth of the company.
If the company’s Reserves are growing roughly at the same rate as the Net Profits of the company, then its a positive sign. Ideally, the reserves of the company must grow because of growth in retained earning.
Let us take a real life example to understand how shareholder’s fund affects the overall financial performance of the company and thus determines price movement of the stock.
JP Associates (Jai Prakash Associated) was engaged in infrastructure development such as engineering and construction.
If you look at the past year’s balance sheet of the company, you will find that company has been continuously its equity since 2007, the growth in reserves is largely contributed by equity dilution.
This is evident from the fact that from 2007 to 2013, the reserves and surplus of the company were seeing healthy growth from Rs. 2,709 crores in 2007 to Rs. 12,109 in 2013, while the Net Profit of the company declined during the same period from Rs.553 crores to Rs.463 crores in 2013.
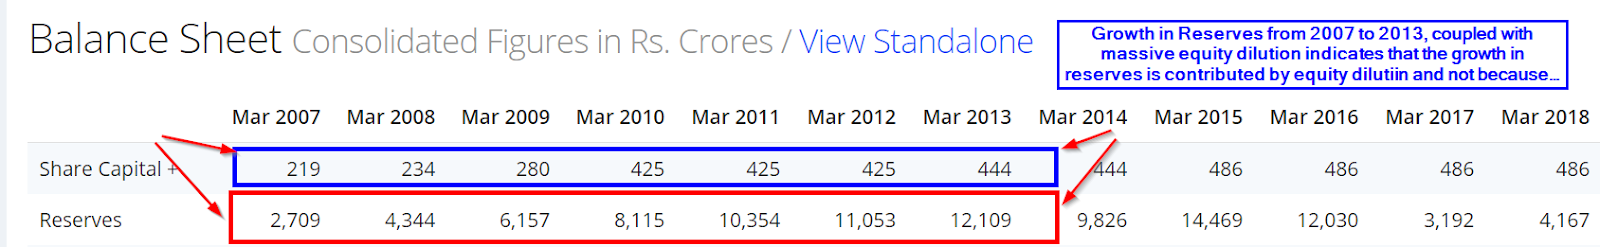
Since the boost in Shareholder’s Equity was contributed by aggressive equity dilution and not because of retained earnings, it was a clear red flag for any investor that the company is eroding shareholder’s equity and thus does not make a good investment.
As a result of this, the fundamentals of the company deteriorated, the stock price plummeted, and in 2018, a case of bankruptcy was filed against the company.
Summary
Before we wrap up this post, here is a quick summary of all the points that we must keep in mind while performing balance sheet analysis.
- Balance sheet is one of the three financial statements that gives you insight into the financial health of a company. A balance sheet is a record of what a company owns and what it owes, just like CIBIL score of an individual.
- Balanced sheet can be divided into three parts Asset (what a company owns) liabilities and equity (what a company owes).
- The first sign of a healthy balance sheet is that, the total assets (minus shareholder’s equity) should be higher than total liabilities, as it shows that in case company liquidates, it will be able to meet its obligations towards their debtors.
- Non current assets are long term assets and current assets are short term assets, which can be converted to cash within a period of 12 months.
- Growing assets are positive for a company but only if the profits are also growing at almost the same rate. If a company is acquiring assets but profits remain lackluster, it indicates that company is unable to use its assets efficiently to generate more profits, its a sign of deteriorating fundamentals (as it happened in the case of Vodafone India).
- Cash and cash equivalents of a company should always be higher than short term liabilities so that the company is able to meet all its obligations on time without risking default.
- Among liabilities, long term borrowing is the most important, and as a thumb rule, it should not exceed beyond half of total shareholder’s fund.
- If a company has too much liabilities, a large part of its income goes into paying the interest cost, leaving almost nothing in the hands of shareholders.
- Shareholder’s Equity is the money invested by the shareholders of the company and is composed of two components, share capital and reserves and surplus.
- Share capital is the capital a company generates from its IPO, and is calculated by multiplying face value of the stock by number of outstanding shares.
- Reserves is the retained earning accumulated by the company over the years, just like we accumulate our savings in our savings account.
- Rising shareholder’s equity is a positive sign but its important to analyze what is adding t the reserves.
- If the reserves of the company is contributed by profits retained by the company, it should be seen as a positive sign, but if the reserves is growing because of equity dilution, then it is a red flag for the investors.
Conclusion
Peter Lynch, one of the most successful fund managers once said, ”The biggest losses in the stock come from poor balance sheet”, the statement itself shows how important the role of a balance sheet is in analyzing stocks to make successful investments.
Balance Sheet analysis is no rocket science, you don’t have to make too many complex calculations to understand it. All you need is some common sense, and rational thinking. I hope you found this article on balance sheet analysis useful and knowledgeable. Do let me know how you analyze businesses while investing, if you have any doubts, feel free to comment down below.